Lifestyle-Related Cancers
Obesity-related Cancers in Mississippi, 2003-2021
Obesity is a modifiable risk factor that increases the risk of developing certain cancers. According to data from the Behavioral Risk Factor Surveillance System for 2022, 40.7% of Mississippi adults ages 20 or older are obese. Mississippi has the third-highest obesity rate in the nation, including the District of Columbia and Puerto Rico1. Cancers that are associated with obesity include colorectal cancer, pancreatic cancer, post-menopausal breast cancer, uterine cancer, ovarian cancer, kidney cancer, adenocarcinoma of the esophagus, gastric cardia cancer, gallbladder cancer, liver cancer, thyroid cancer, multiple myeloma and meningioma. Below are graphs of the trends in obesity-related cancers over the period 2003 to 2021 by race and sex with a description of the trends occurring in each group, both for the full time period and for the most recent period between 2017 and 2021. All analysis was done using SEER*Stat software2.
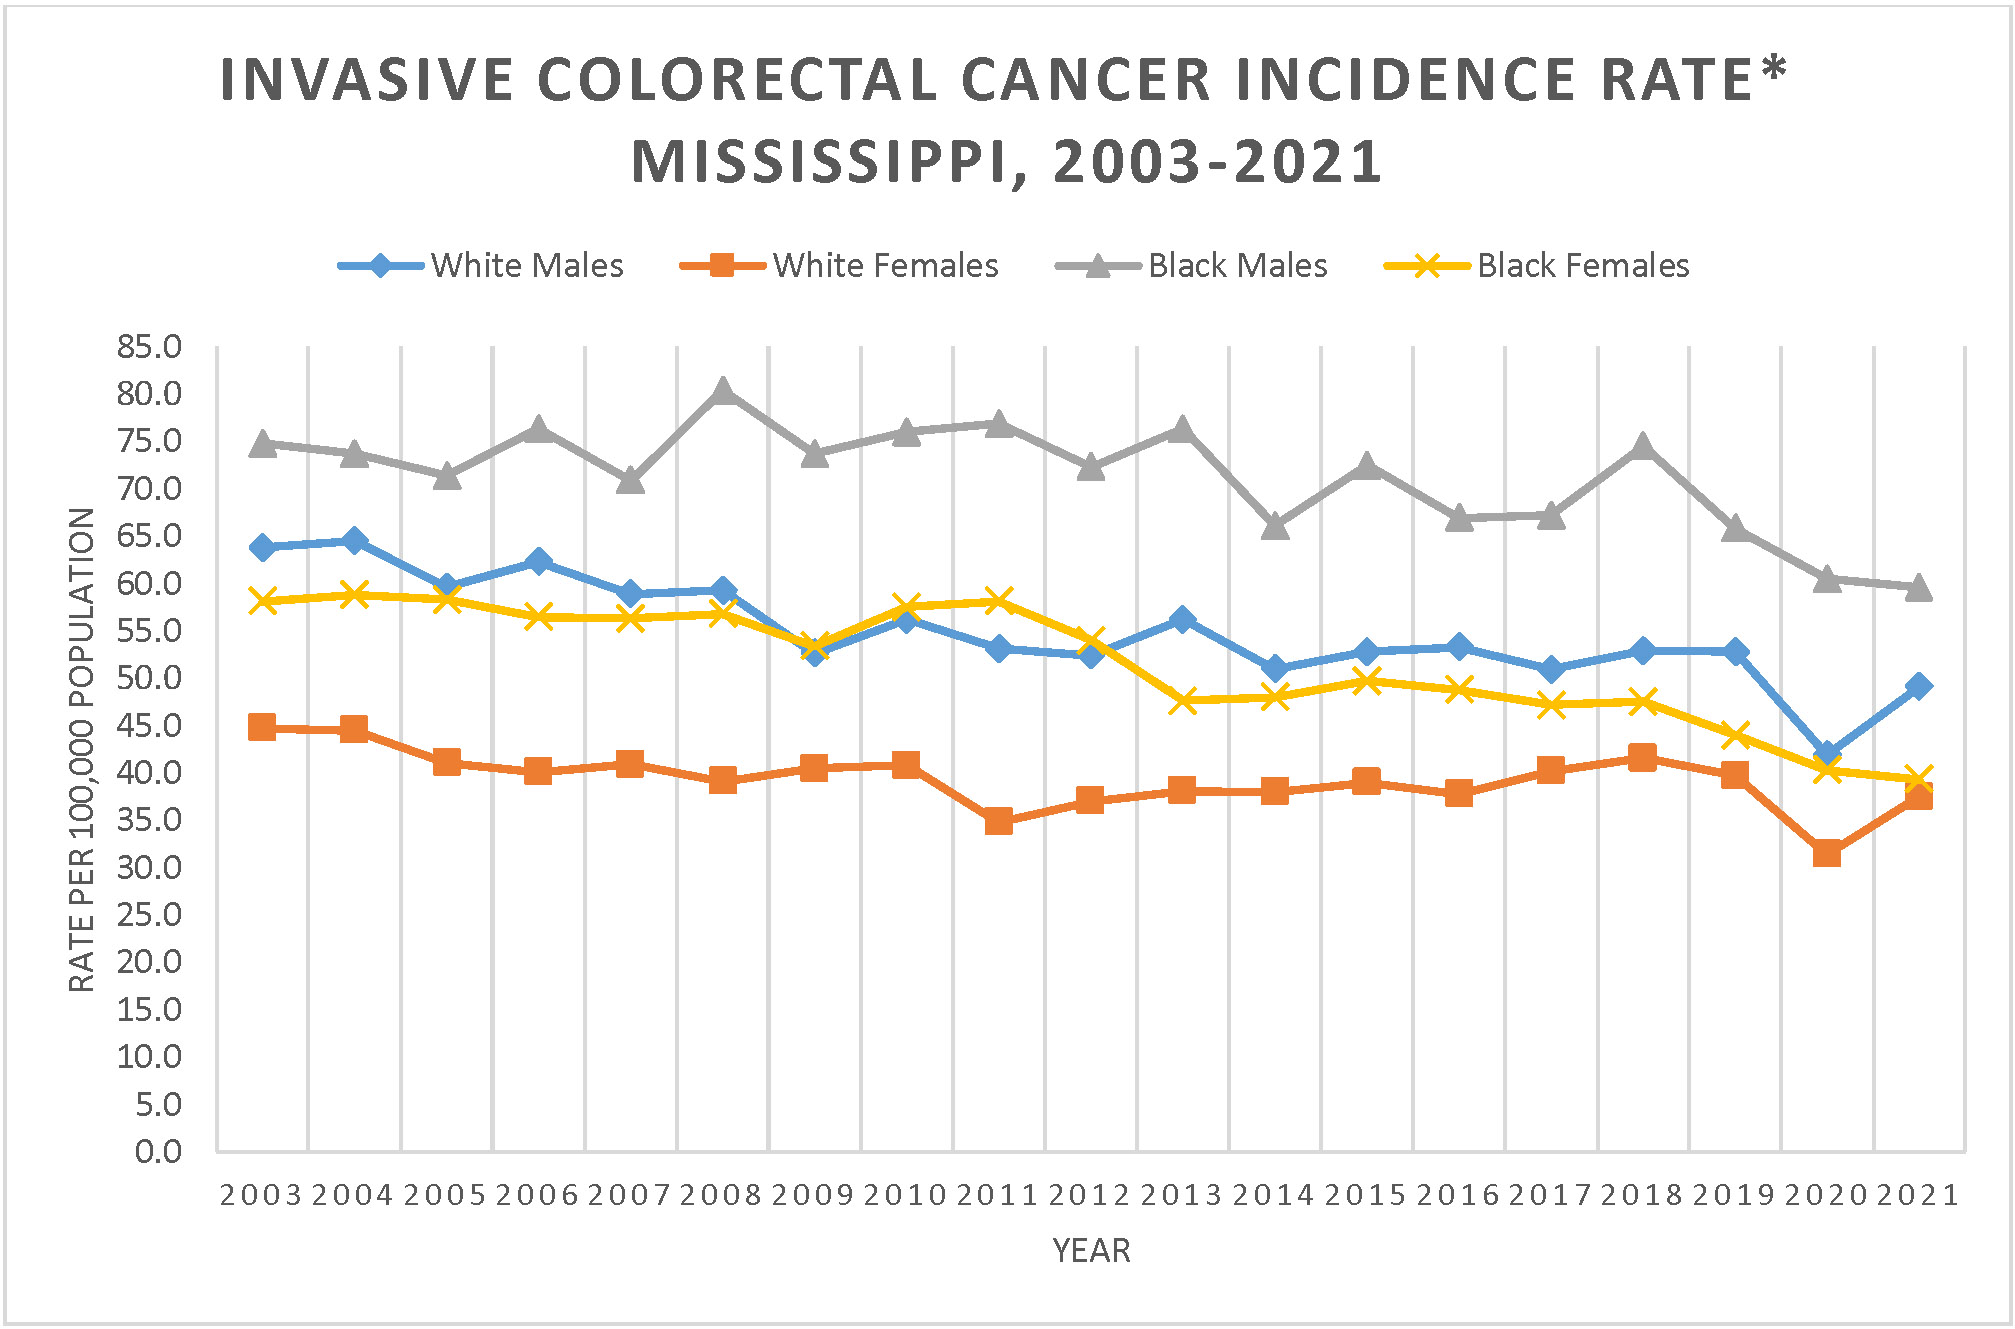
While colorectal cancer is associated with obesity, it is also associated with other modifiable risk factors, alcohol use (both colon and rectum cancers), tobacco use (both colon and rectum cancers) and lack of physical activity (only colon cancer). Black males had significantly higher rates of colorectal cancer than all other groups except for in years 2003 and 2004 where their rates were similar to those of white males. Colorectal cancer rates decreased significantly in all groups except black males for the period between 2003 and 2021. White females had a significant decrease of 0.79% annually and white males had a significant decrease of 1.53% annually. Black females experienced an annual observed decrease of 0.64% between 2003 and 2011, followed by a significant decrease annually of 3.04% between 2011 and 2021. These patterns translate into a significant average annual percent decrease of 2.0% for black females over the full time period. Between 2003 and 2018, black males had an observed decrease of 0.51% annually. Between 2018 and 2021, black males experienced a significant decrease of 6.01% annually. These patterns translate into an observed average annual decrease of 1.4% for black males over the full time period.
For the latest five-year period of 2017 to 2021, all groups experienced an observed decrease, but only black females experienced a significant decrease. Black females had a significant annual decrease of 5.18%. For black males, the observed annual rate of decrease was 4.47%. White females had an observed annual decrease of 3.775 and white males had an observed annual decrease of 2.82%.
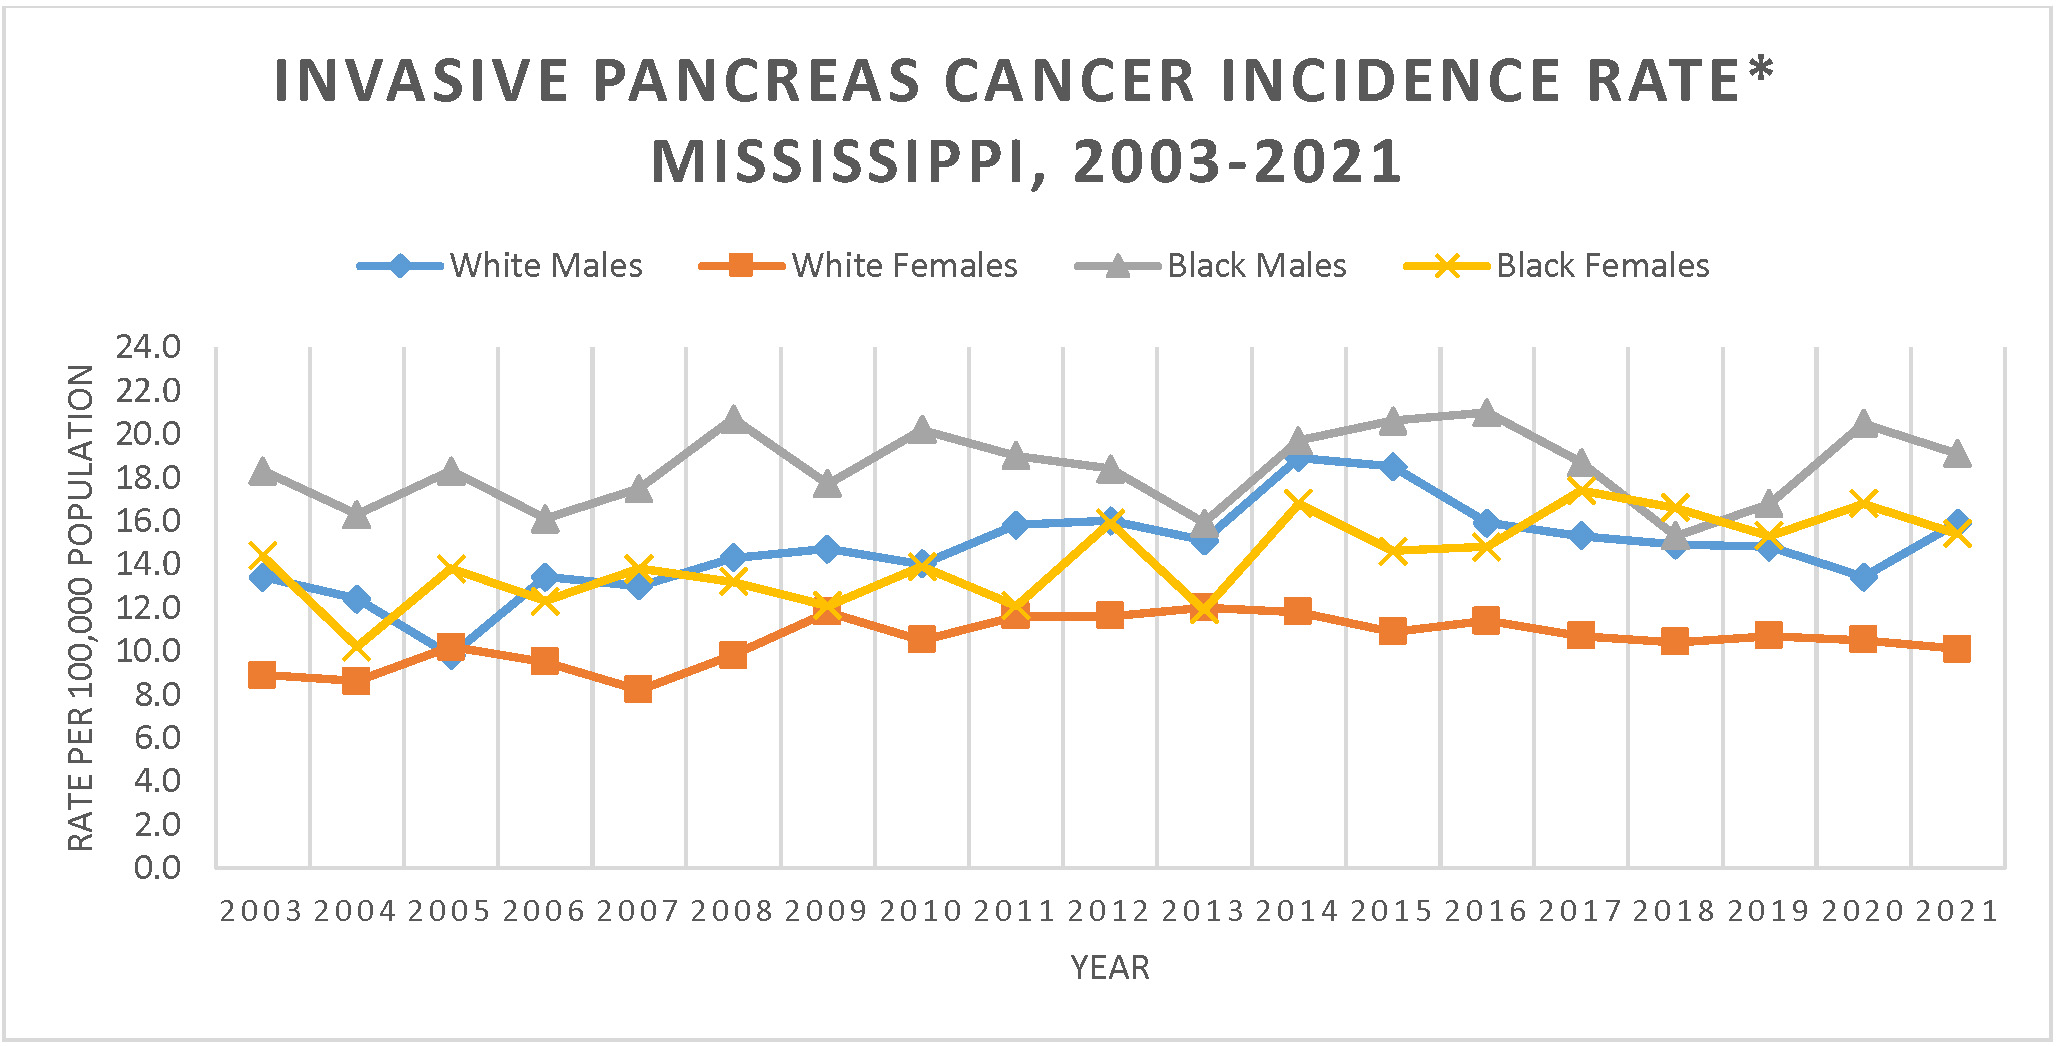
While pancreatic cancer is associated with obesity, it is also associated with another modifiable risk factor, tobacco use. Pancreatic cancer rates increased significantly between 2003 and 2021 for females, overall. White females experienced annual significant increase of 3.17% between 2003 and 2013 but then saw and observed 2.06% decrease between 2013 and 2021. Overall, white females had an observed average annual increase of 0.8%. The rate for black females increased a significant 1.65% annually. For males, the average annual percent change between 2003 and 2021 was an observed increase of 0.90%. Black males had an observed increase of 0.33% annually. White males experienced a significant increase between 2003 and 2014 of 3.60% annually but then experienced a significant decrease annually between 2015 and 2021 of 2.64%. This translates into a statistically significant average annual increase of 1.1% over the full time period.
For the latest five-year period of 2017-2021, the trends were decreasing for all groups except black males who saw an increasing trend. White males had an observed decrease of 0.09% annually. For black males, the most recent trend observed is an increase of 3.18% annually and for black females the observed trend for the most recent five years was a 2.27% decrease annually. White females had an observed annual decrease of 1.03%.
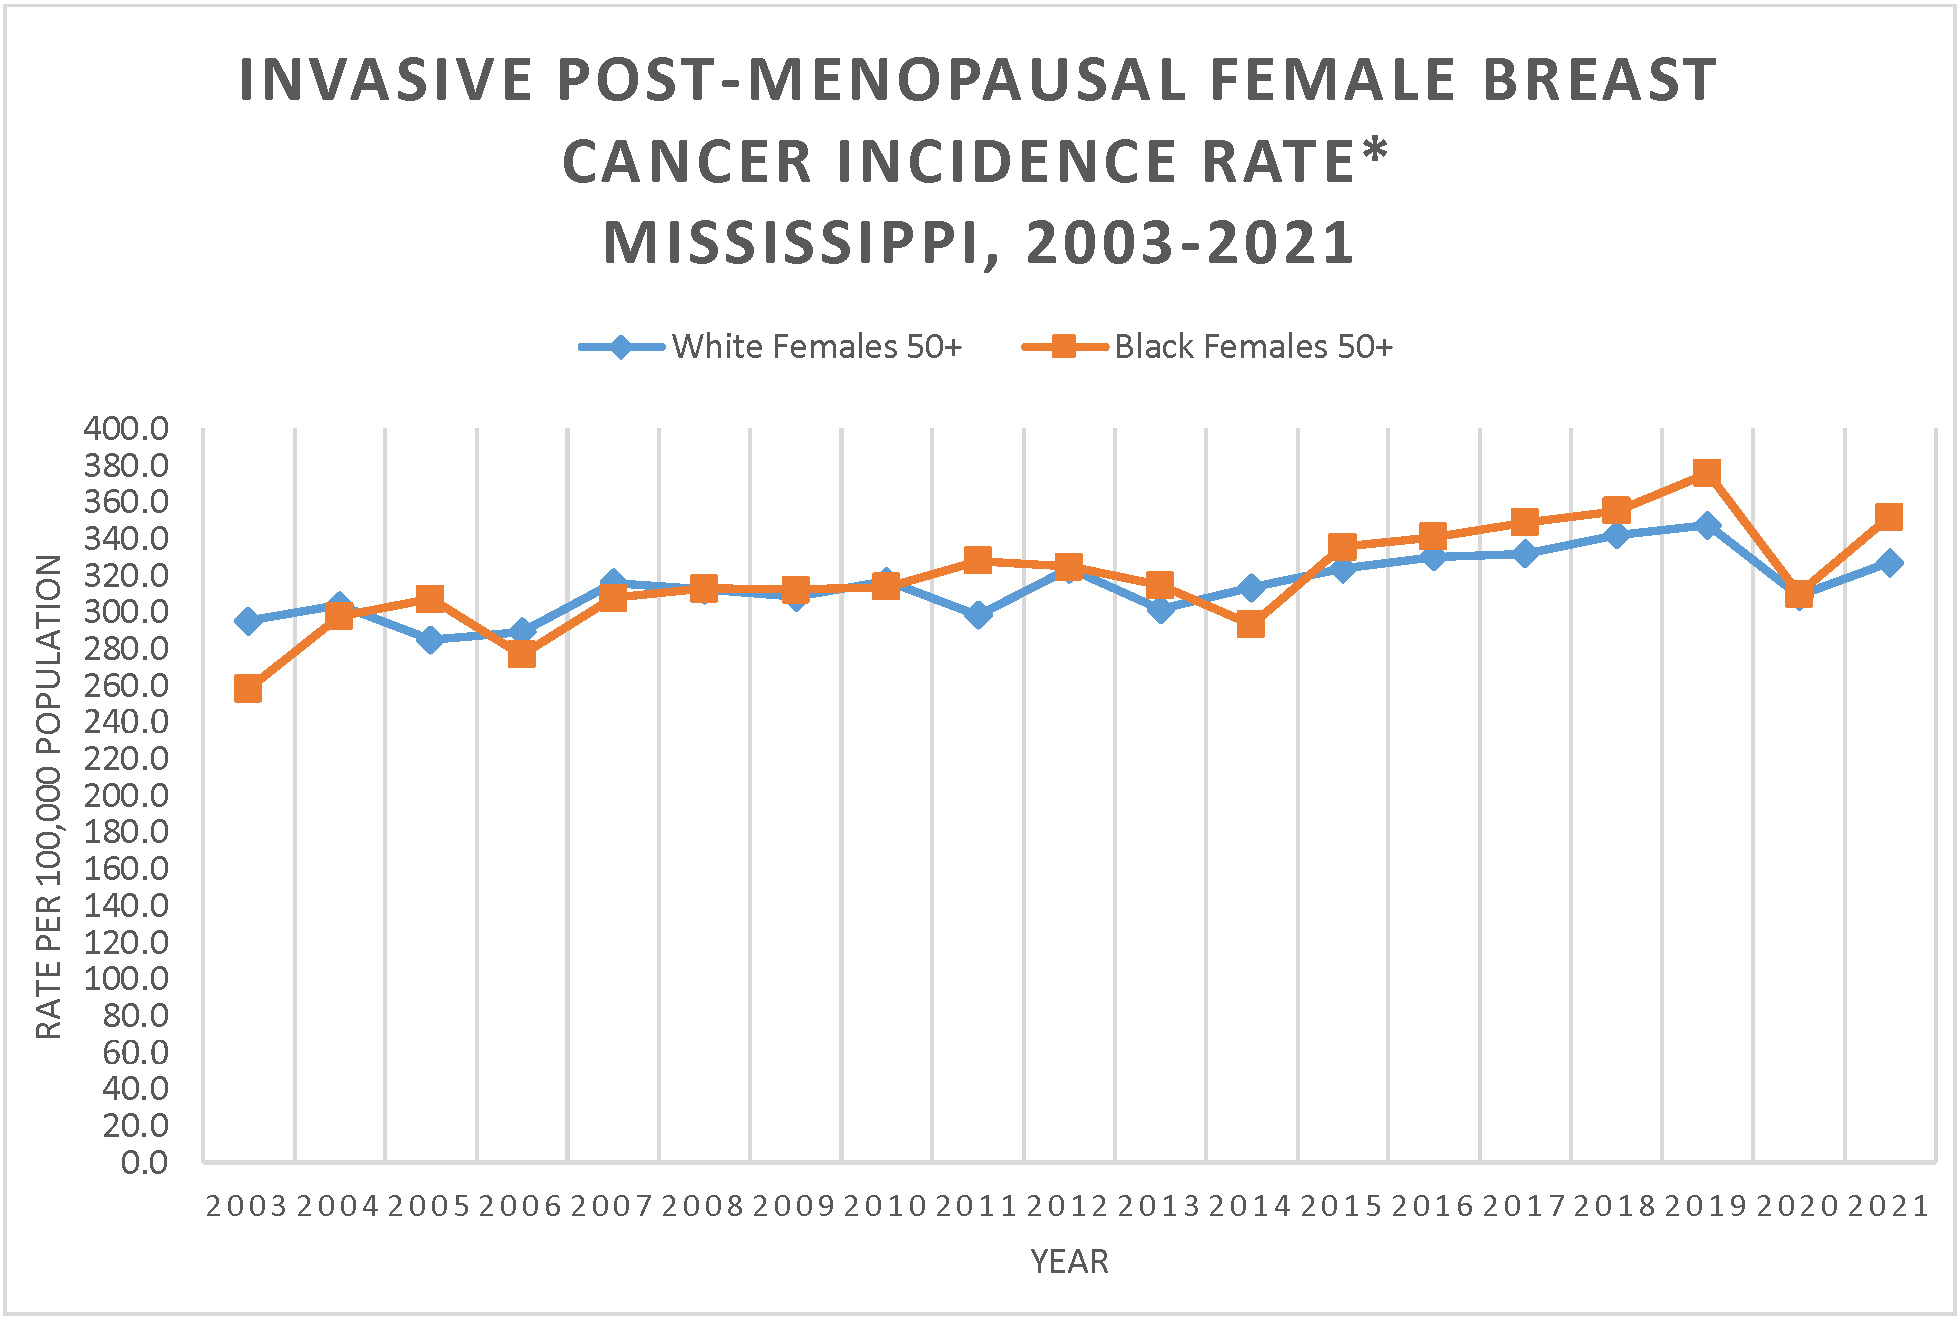
Post-menopausal breast cancer is defined as breast cancer diagnosed in women ages 50 and older. Not only is post-menopausal breast cancer associated with obesity, it is also associated with another modifiable risk factor, a lack of physical activity. Rates of post-menopausal breast cancer are similar between white females and black females. The rates of post-menopausal breast cancer between 2003 and 2021 increased significantly by 0.87% annually. The annual percent change for white females was a significant 0.71% and for black females was a significant 1.21%. For the most recent five-year time from 2017 to 2021, white females experienced an observed decrease of 1.27% annually. Black females also experienced an observed annual decrease over the period of 2013 to 2021 of 1.08%.
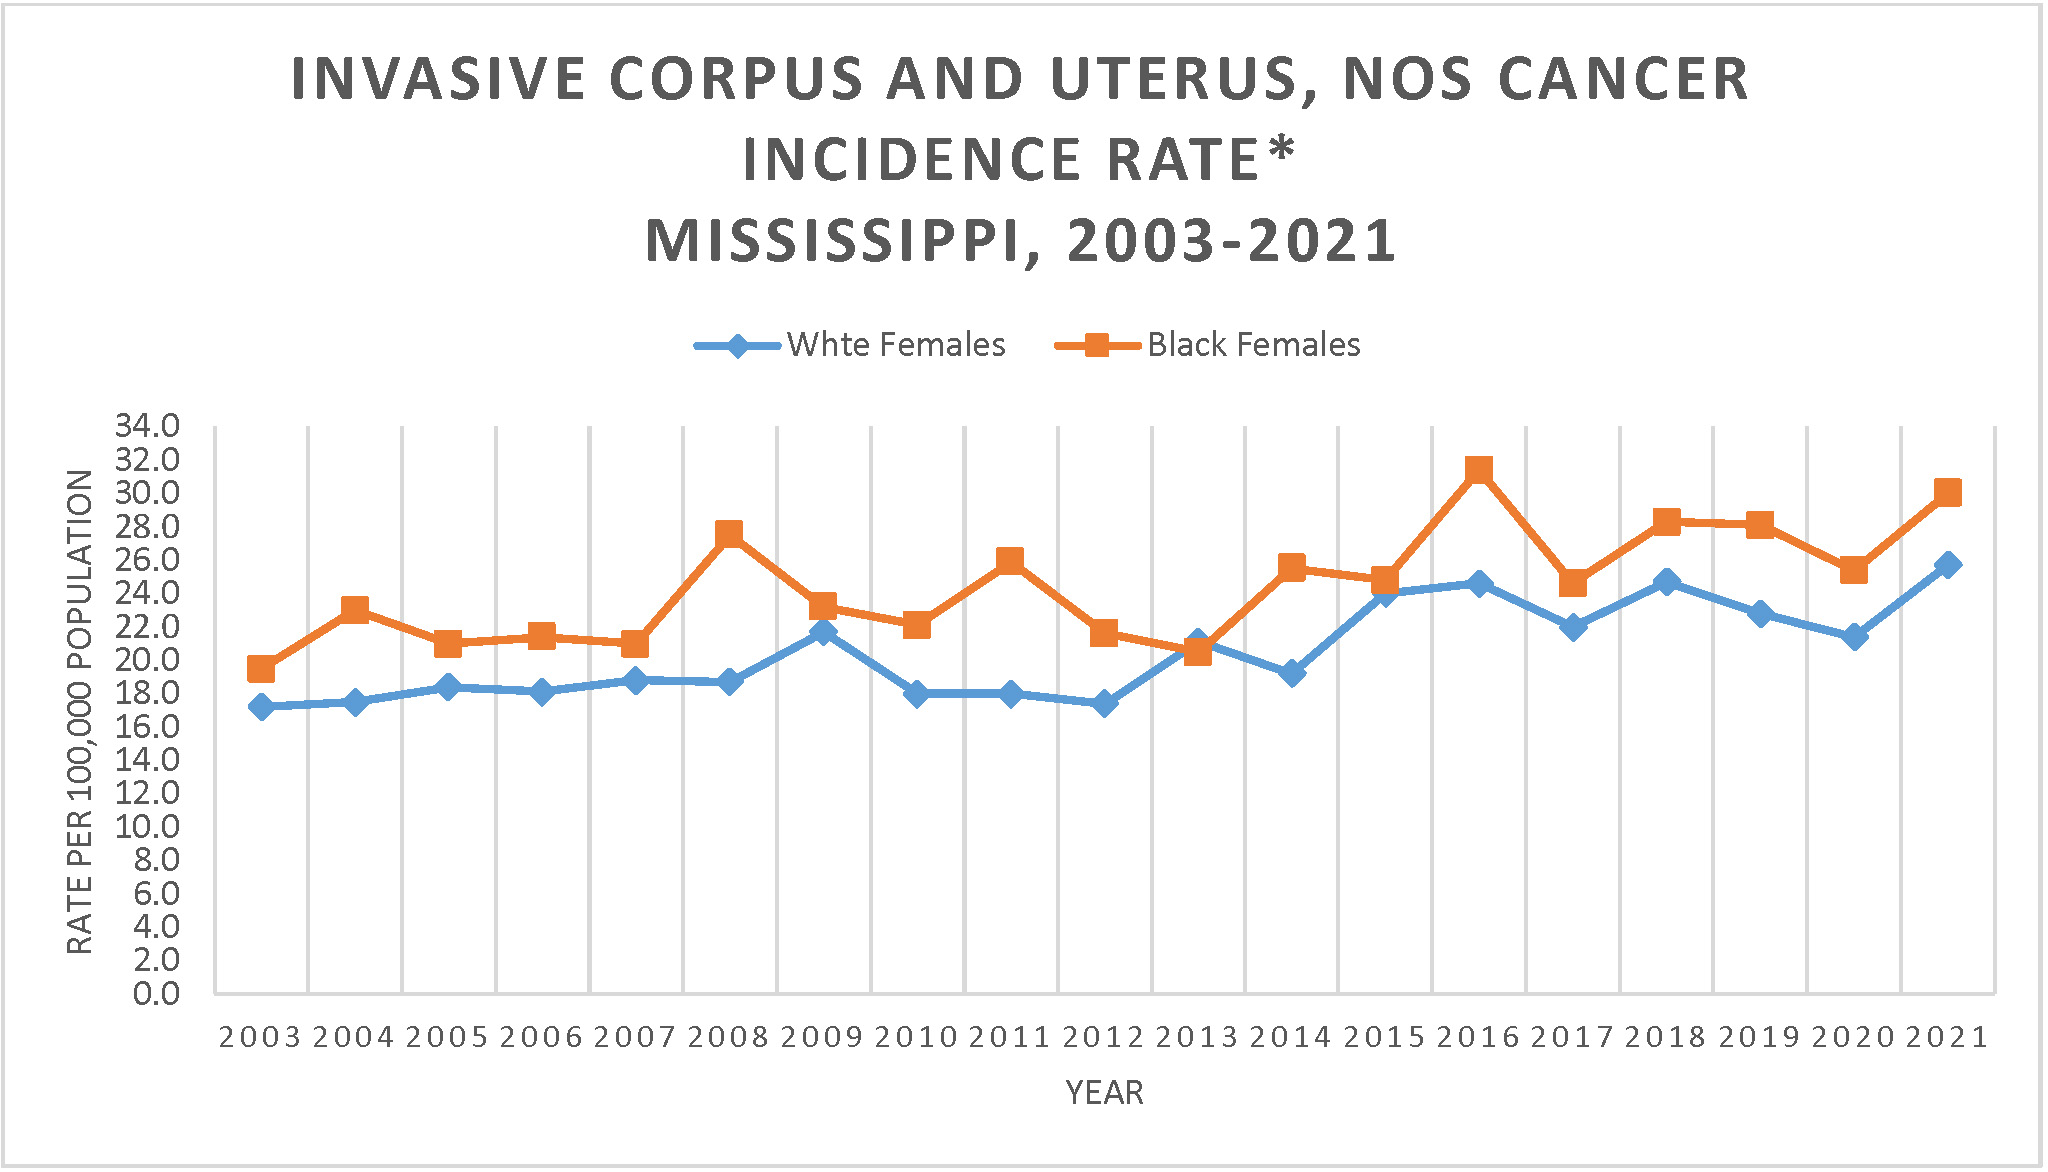
Uterine cancer is not only associated with a lack of physical activity, but is also associated with another modifiable risk factor, obesity. Uterine cancer rates increased significantly between 2003 and 2021. The annual percent change over that period of time was 2.01%. Black females experienced a significant increase of 1.79% annually and white females experienced a significant increase of 2.00%. The trend over the latest five-year period from 2017 to 2021 for black females was an annual increase of 3.04% which was not statistically significant. For white females, there was an increase of 1.73% annually. Though black females have rates that are observed to be higher than white females for all years except 2013, these differences are only statistically significant for years 2004, 2008, 2011, 2014, 2016 and 2019.
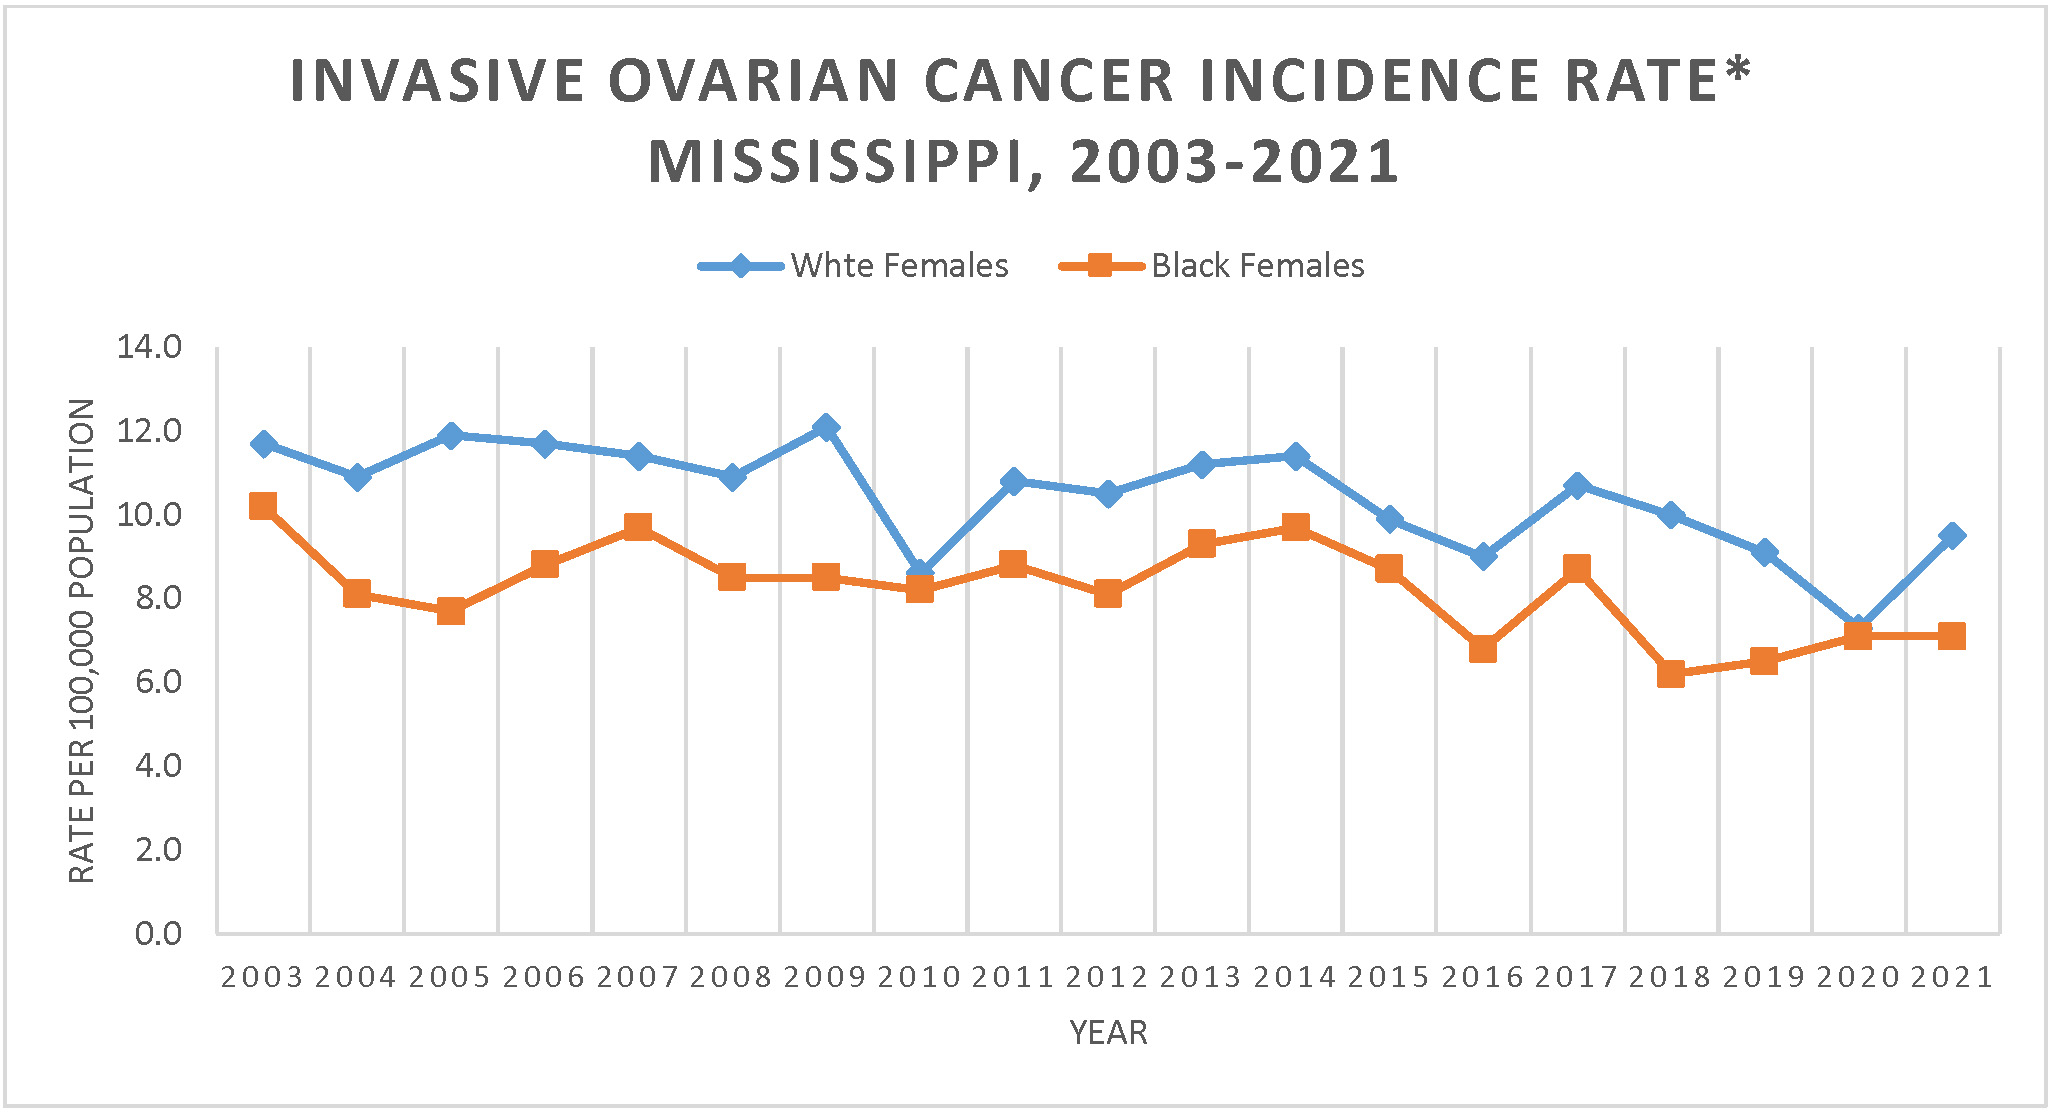
Rates for ovarian cancer were similar between white females and black females for all years but 2005, 2009 and 2018 where white females had significantly higher rates. Both white and black females had decreases over the period from 2003-2021, though the change was only statistically significant for white females. White females experienced a 1.49% decrease annually and black females experienced a 1.49% decrease annually. In the most recent five-year time period between 2017 and 2019, both groups experienced annual declines though the changes were not statistically significant. White female rates declined 5.41% annually and black female rates were observed to decline at 3.45% annually.
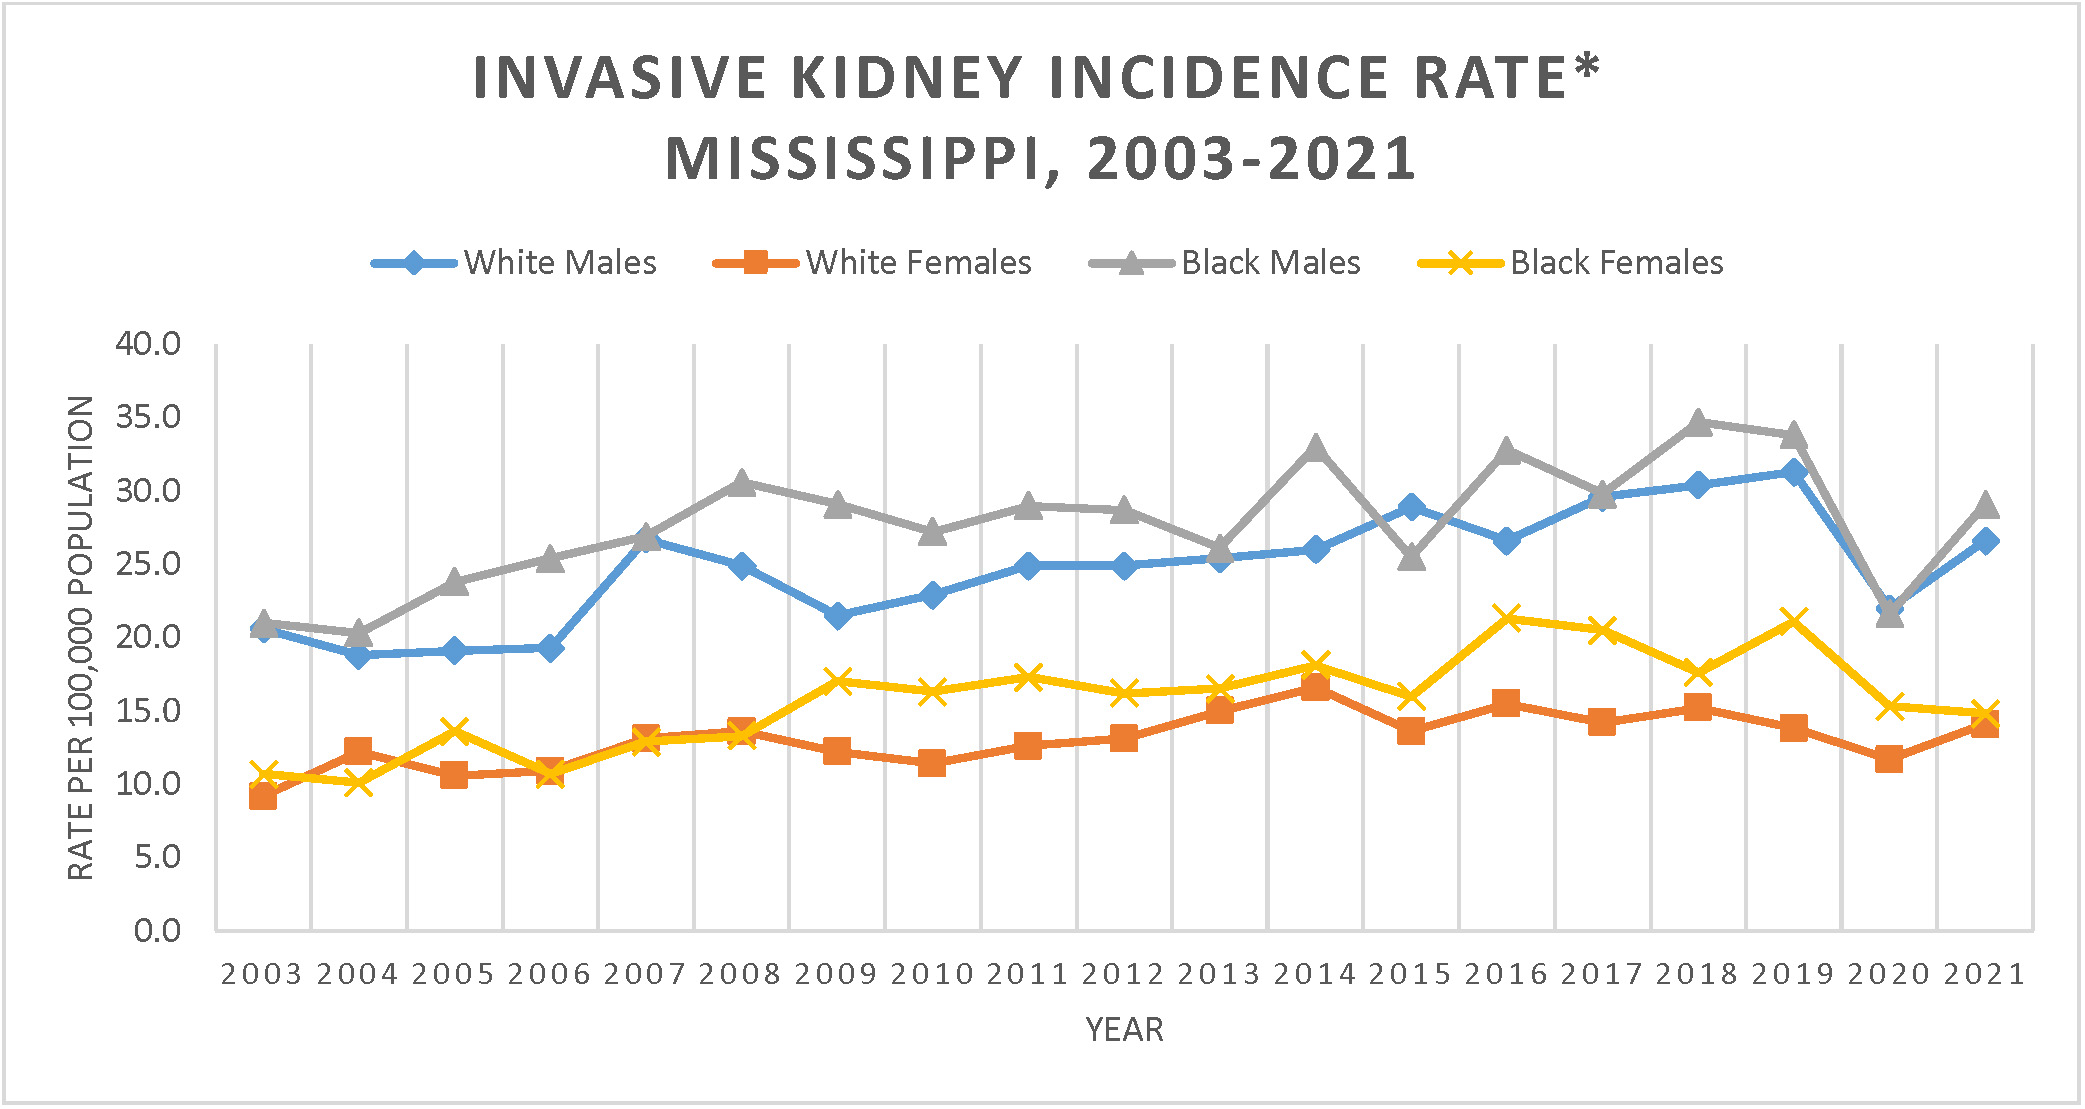
Rates of kidney cancer were similar between black males and white males for most years. Additionally, the rates for white females and black females were also similar to each other for all years except 2009 to 2011 and the most recent years of 2016, 2017 and 2019 where black females had significantly higher rates. White females consistently had rates that were significantly lower than the rates of both black males and white males. Black females had rates that were significantly lower than black males. Their rates were also significantly lower than white males for all years except 2009.
All groups showed an increasing trend for the period from 2003 to 2021, those none were statistically significant. For white males, the rate increased significantly annually 2.89% between 2003 and 2018 and then was observed to decrease 6.17% annually between 2018 and 2021. This translates into an observed increase of 1.3% annually over the full time period. For white females, the rate increased significantly at an annual rate of 3.57% between 2003 and 2014 and the rate was observed to decrease 1.82% annually between 2014 and 2021. This translates into an observed increase of 1.4% annually for the full time period. Black males experienced and observed increase of 1.36% annually. For black females, the rate significantly increased 4.62% per year between 2003 and 2017 and was observed to decrease 7.46% annually between 2017 and 2021. This translates into an observed annual increase of 1.8% for the full time period.
For the latest five-year period of 2017 to 2021, all groups experienced a decrease, though no group had a significant change. The annual decrease for white males was 5.00% and for black males was 4.75%. The decrease for black females was 7.46% annually and for white females was 2.55%.
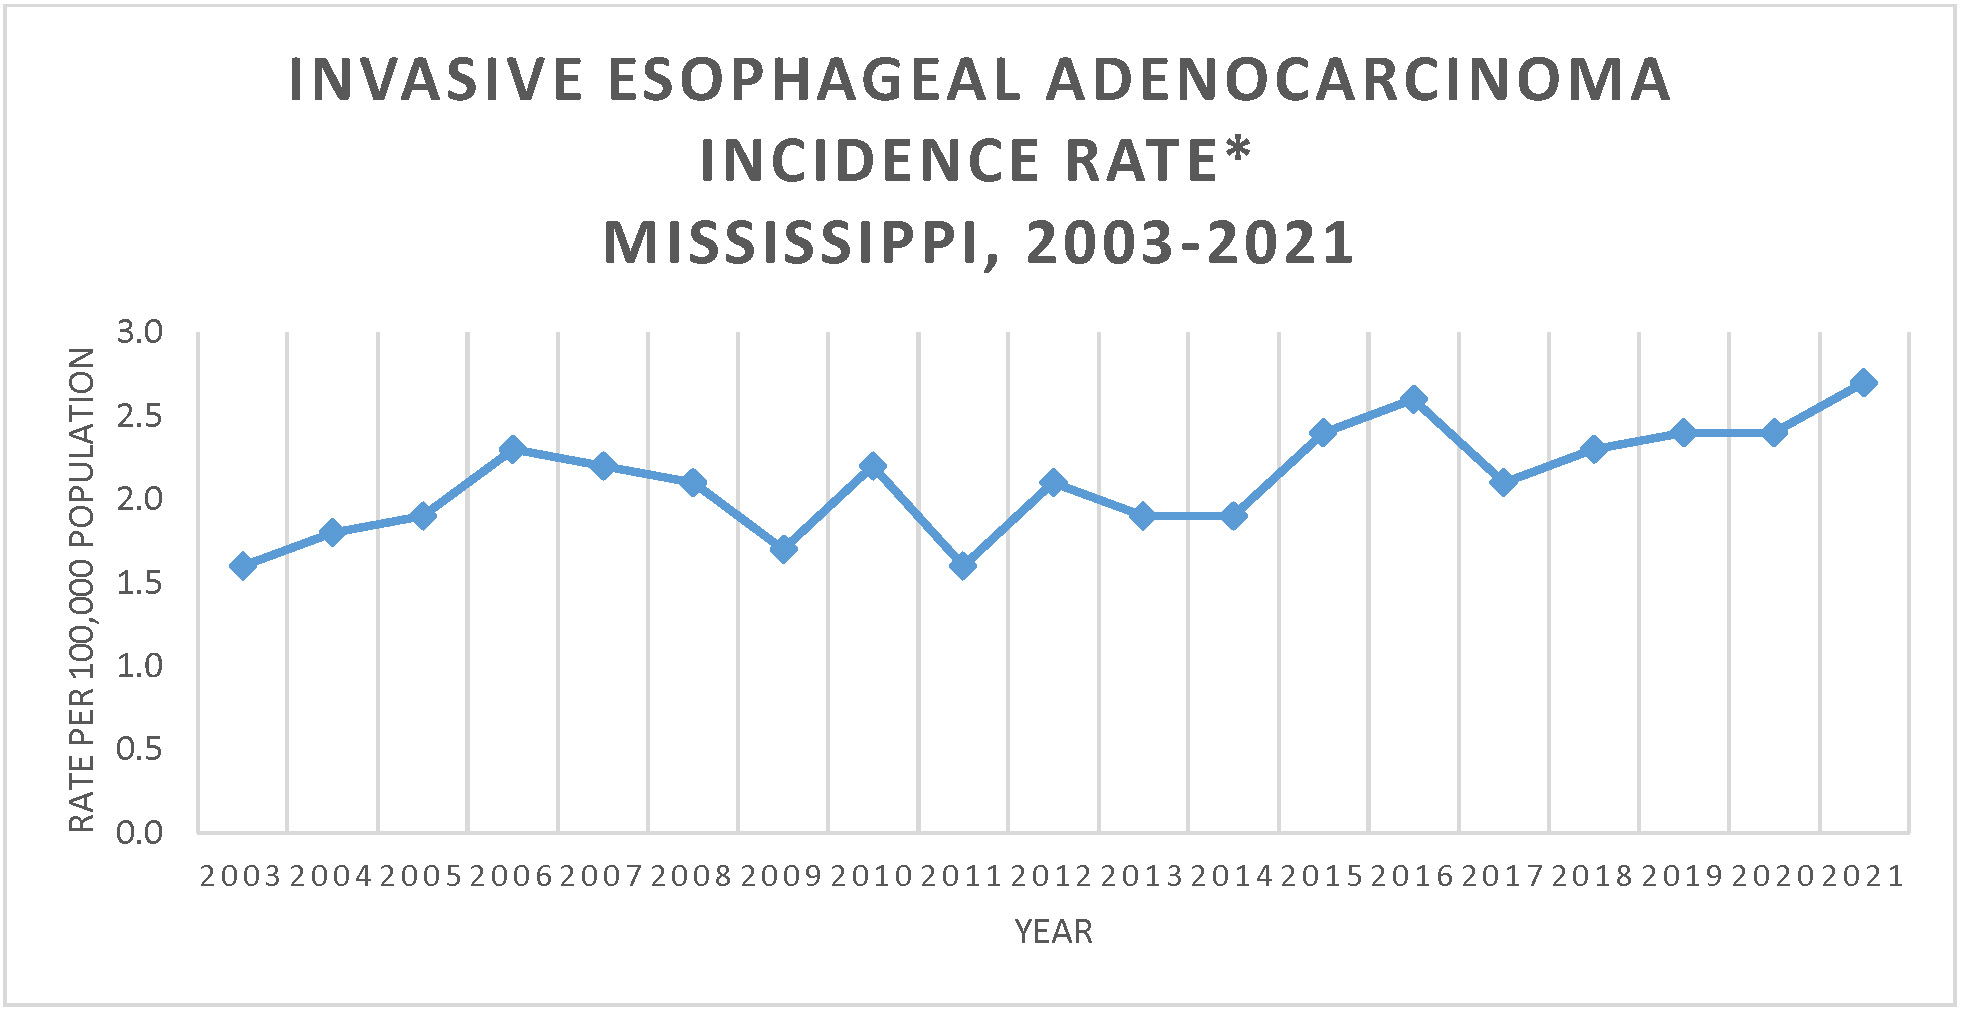
Adenocarcinoma of the esophagus is one type of esophageal cancer that is associated with obesity. Because this is a rare cancer, the statistics could not be broken out by race and sex. Overall, the trend for esophageal cancer for the period from 2003 to 2021 was significantly increasing at an annual rate of 1.88%. For the latest five-year period of 2017 to 2021, the trend was increasing at an observed rate of 5.84% annually.
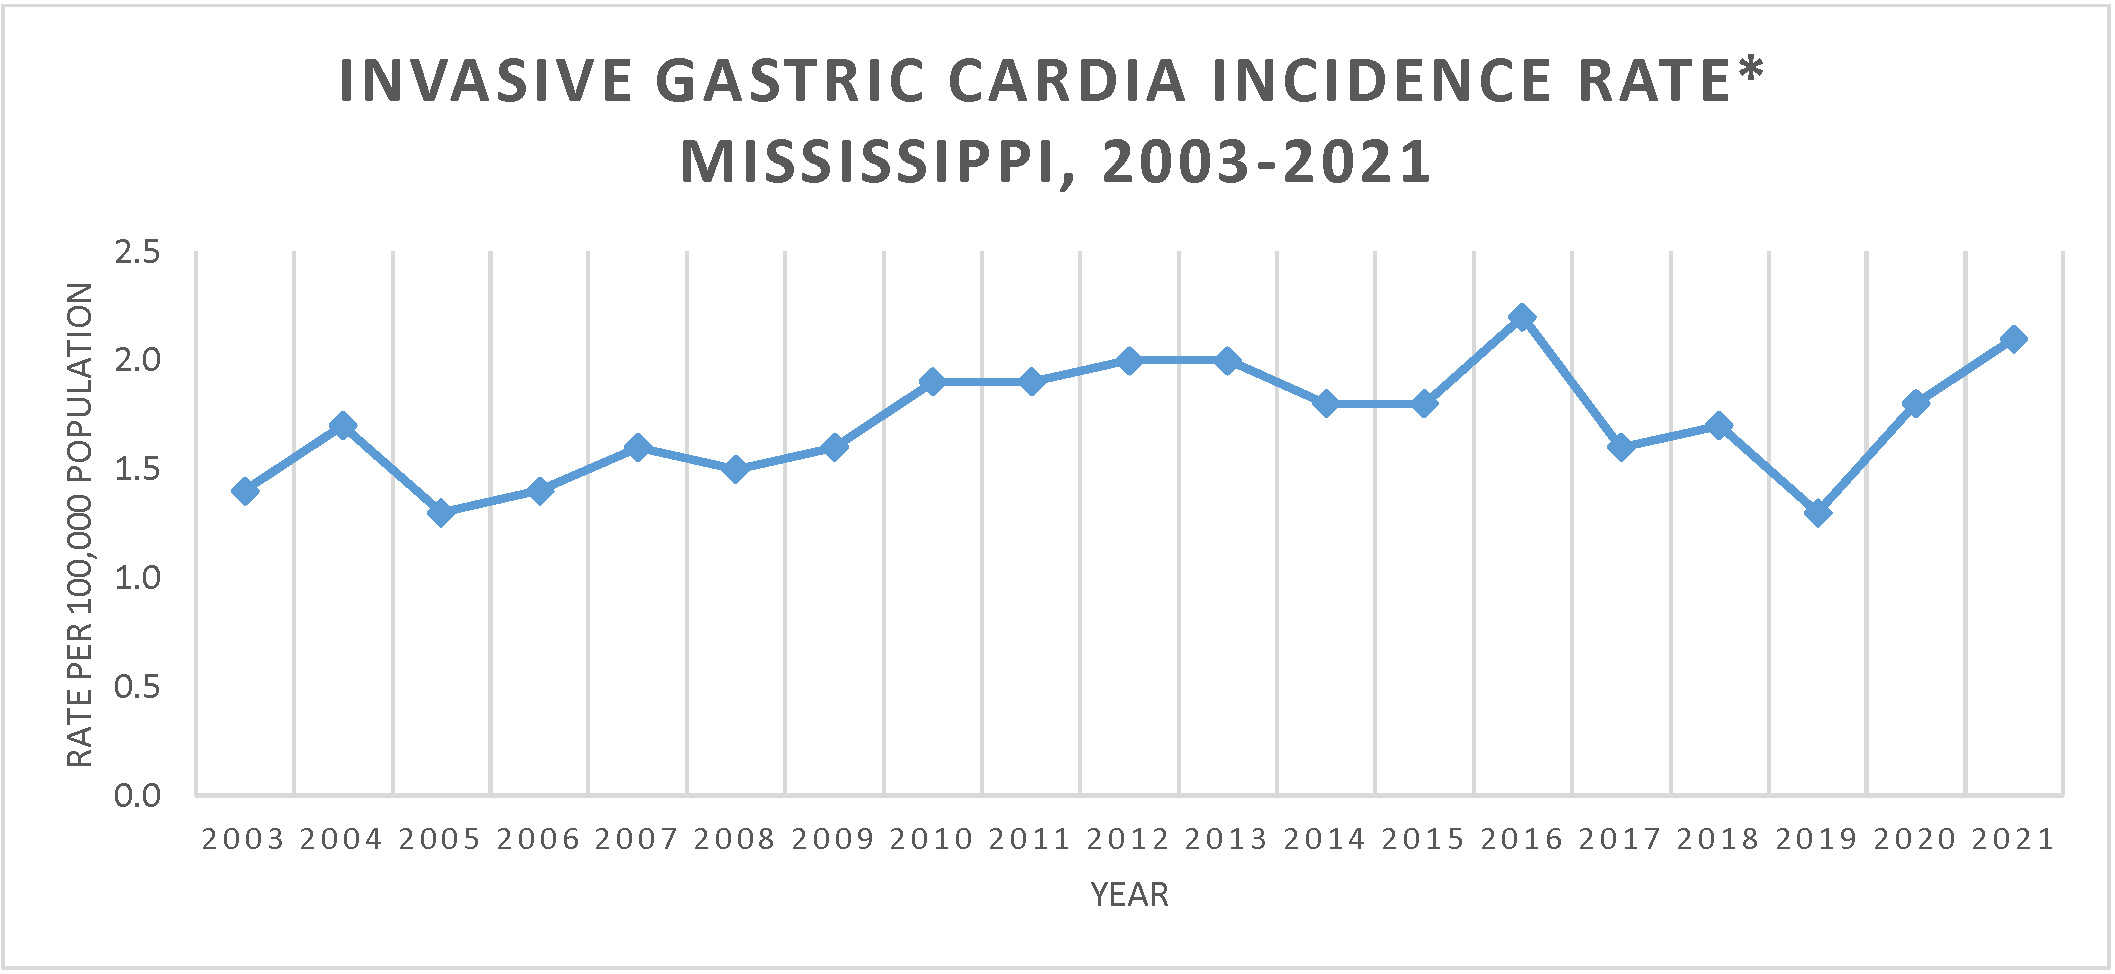
Cancer occurring in the cardia portion of the stomach is associated with obesity. Similar to esophageal adenocarcinoma, this is a rare cancer, so the statistics could not be broken out by race and sex. Overall, the trend for cancer of the gastric cardia for the time period between 2003 to 2021 was an observed increase of 1.26% annually. For the latest five-year period of 2017 to 2021, the trend was a increase of 6.98% annually, though this trend was not statistically significant.
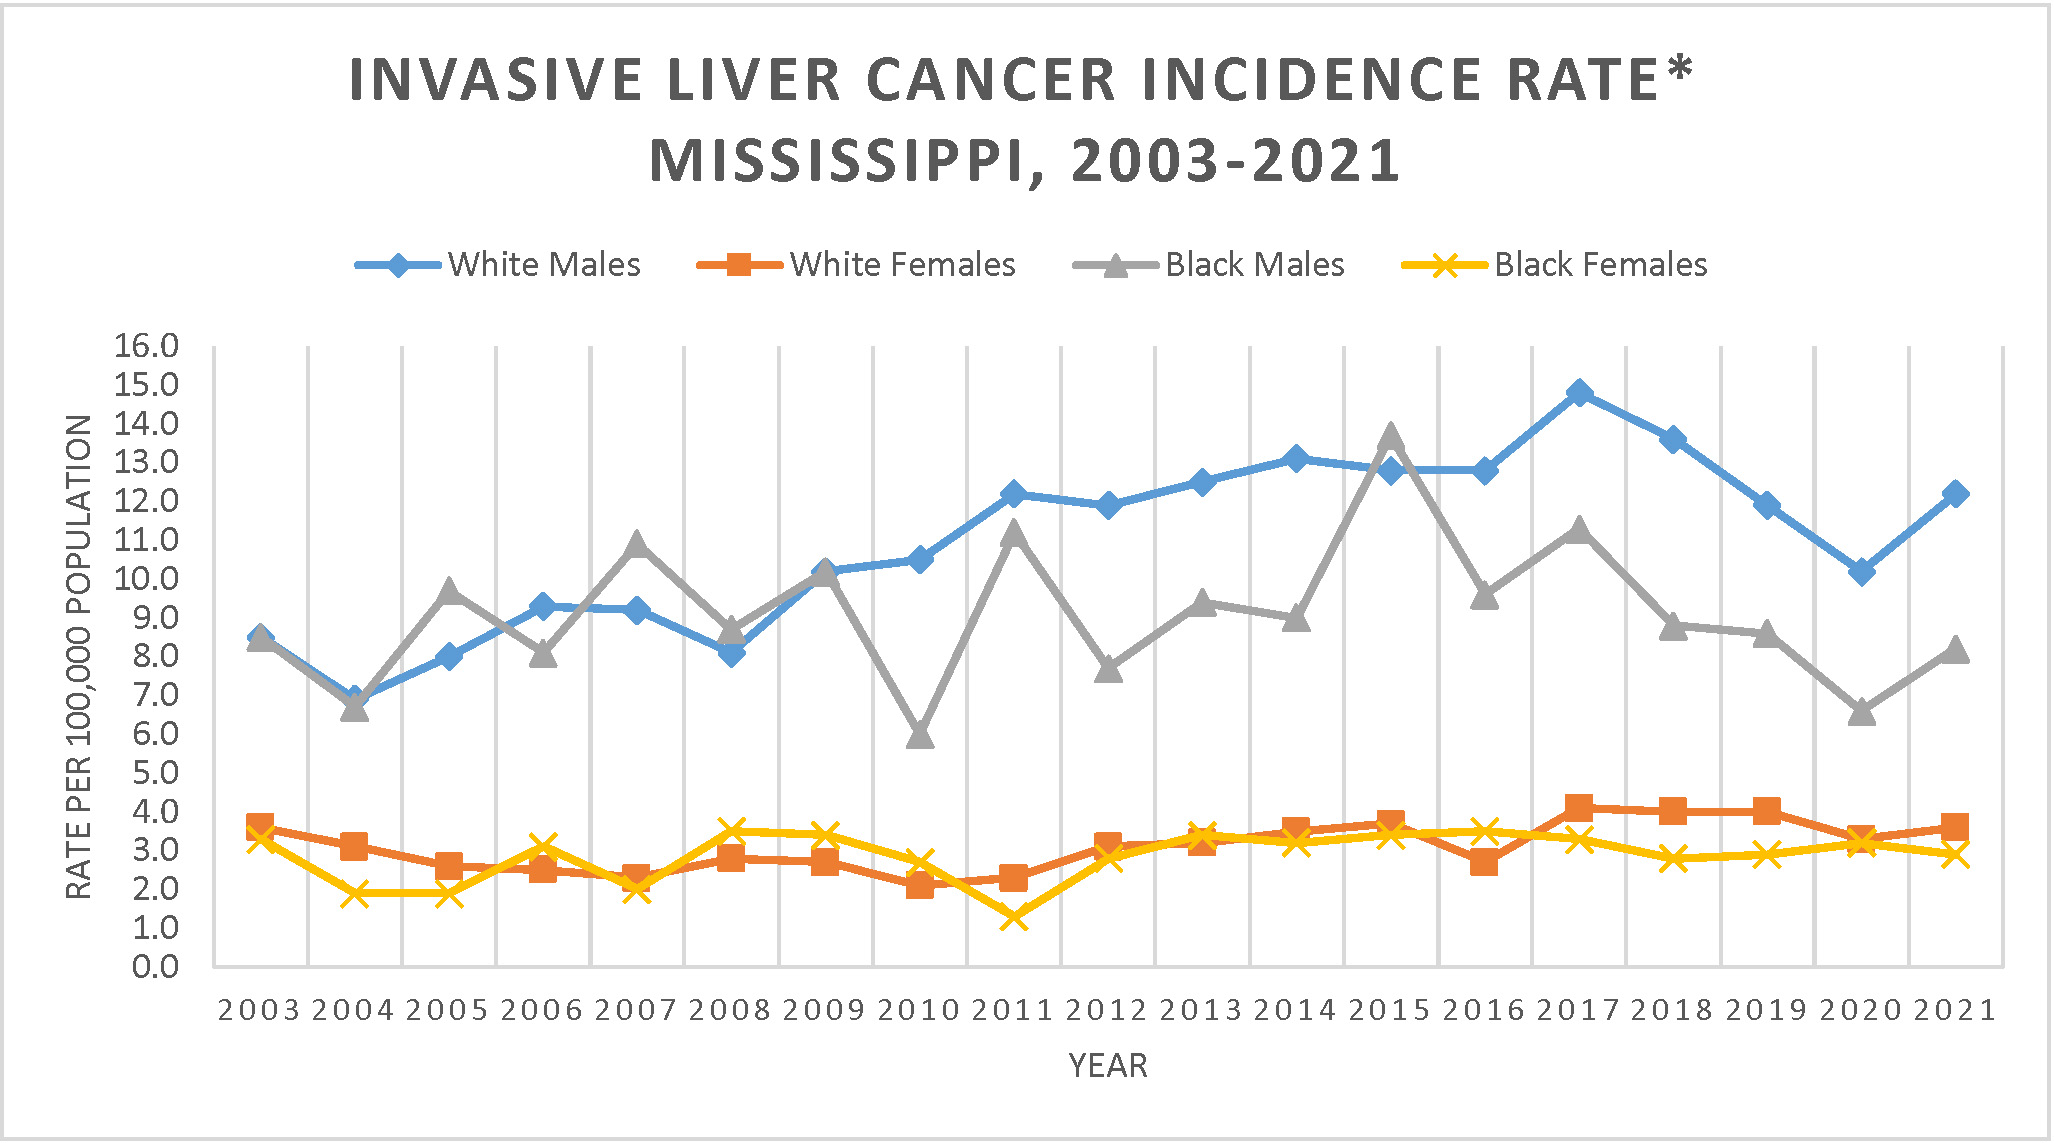
While liver cancer is associated with obesity, it is also associated with two other modifiable risk factors, alcohol use and tobacco use. The rates were similar between the races for females and for males prior to 2012. Beginning in 2012, white males had significantly higher rates that black males for many of those years. For white males, the incidence rate increased significantly between 2003 and 2017 at a rate of 4.58% annually. Between 2017 and 2021, the rate for white males decreased significantly at a rate of 6.65% annually. The rate for white females showed an annual decrease of 12.50% from 2003 to 2006, but then showed a significant increasing trend from 2006 to 2021 with an annual increase of 3.51%. The observed annual percent increase for black males was 0.10% and for black females was 1.19%.
For the latest five-year period of 2017 to 2021, trends were decreasing for all groups. For white males, the trend for the last five-year period was a decrease of 6.48% annually and for black males, the most recent trend observed was a decrease of 8.61% annually. For black females, the decrease was 1.47% annually and for white females, the decrease was 4.28% annually.
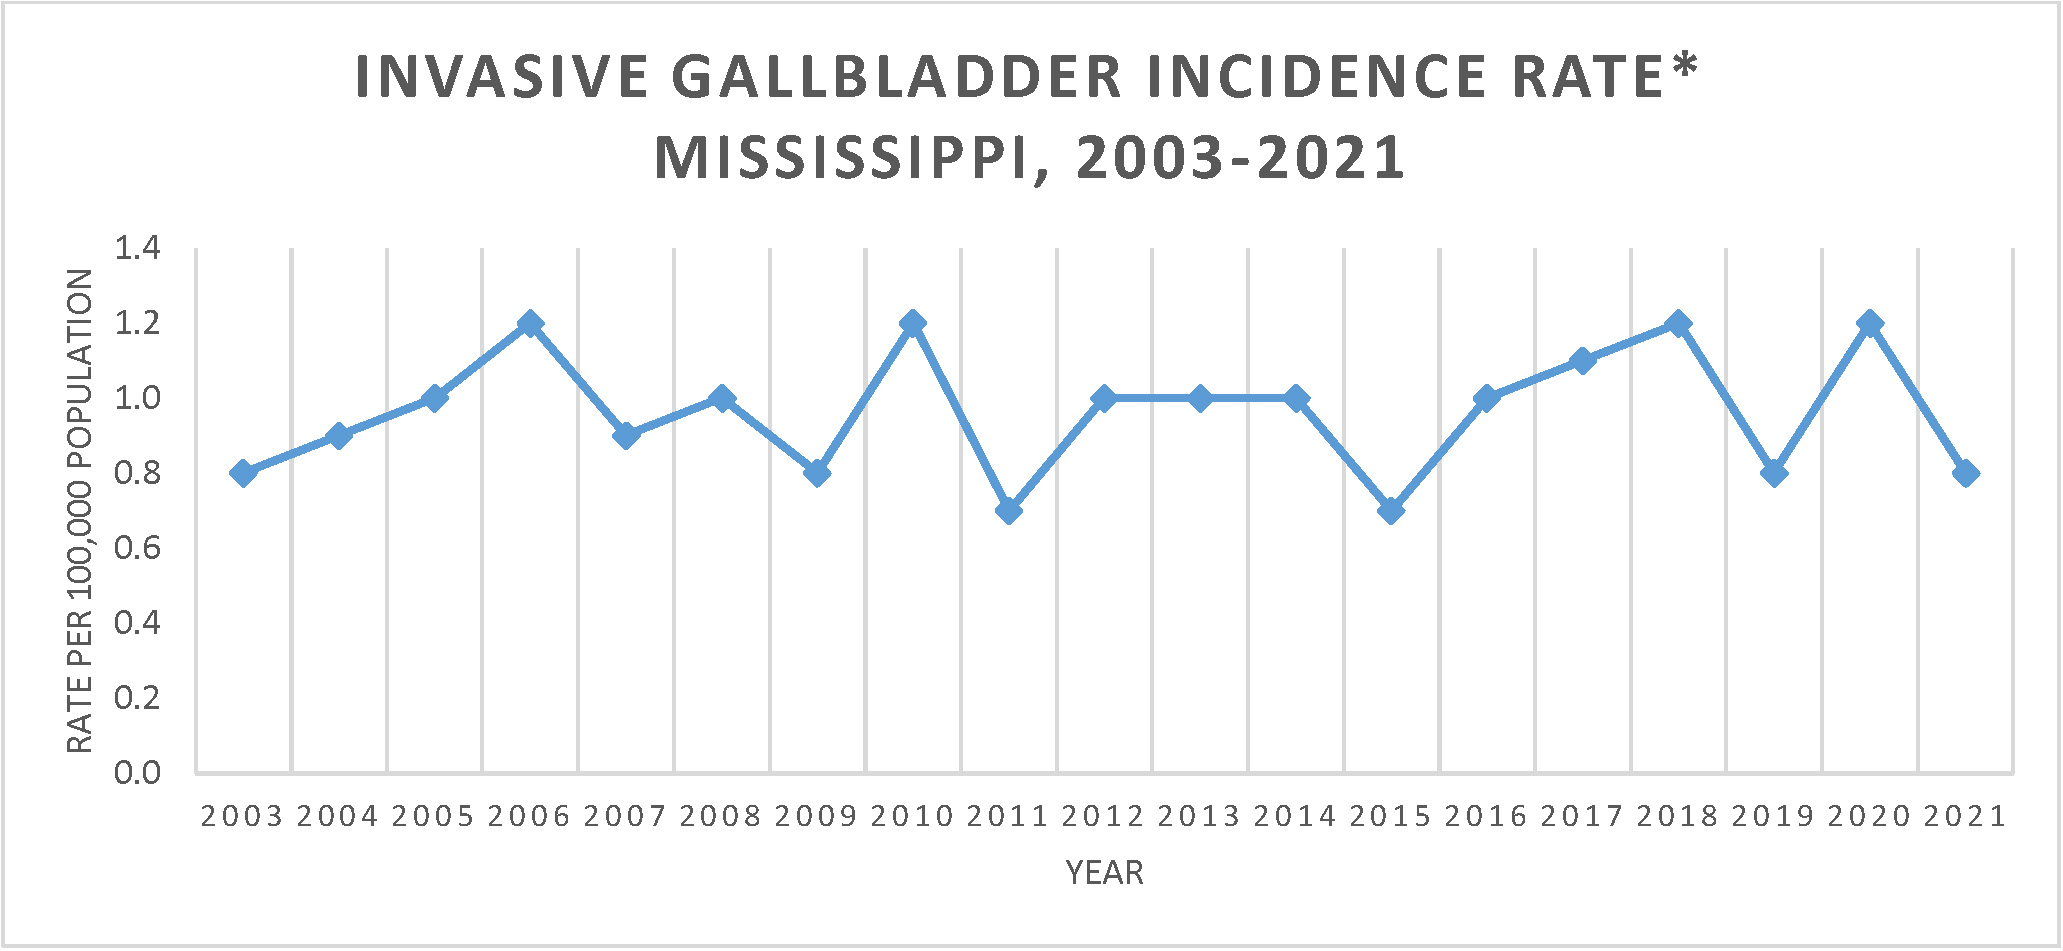
Gallbladder cancer is a rare cancer, so the statistics could not be broken out by race and sex. Overall, the trend for gallbladder cancer for the period from 2003 to 2021 was slightly decreasing annually at 0.16%. This change was not statistically significant. In contrast, for the latest five-year period of 2017 to 2021, the trend was an observed annual decrease of 7.63%.
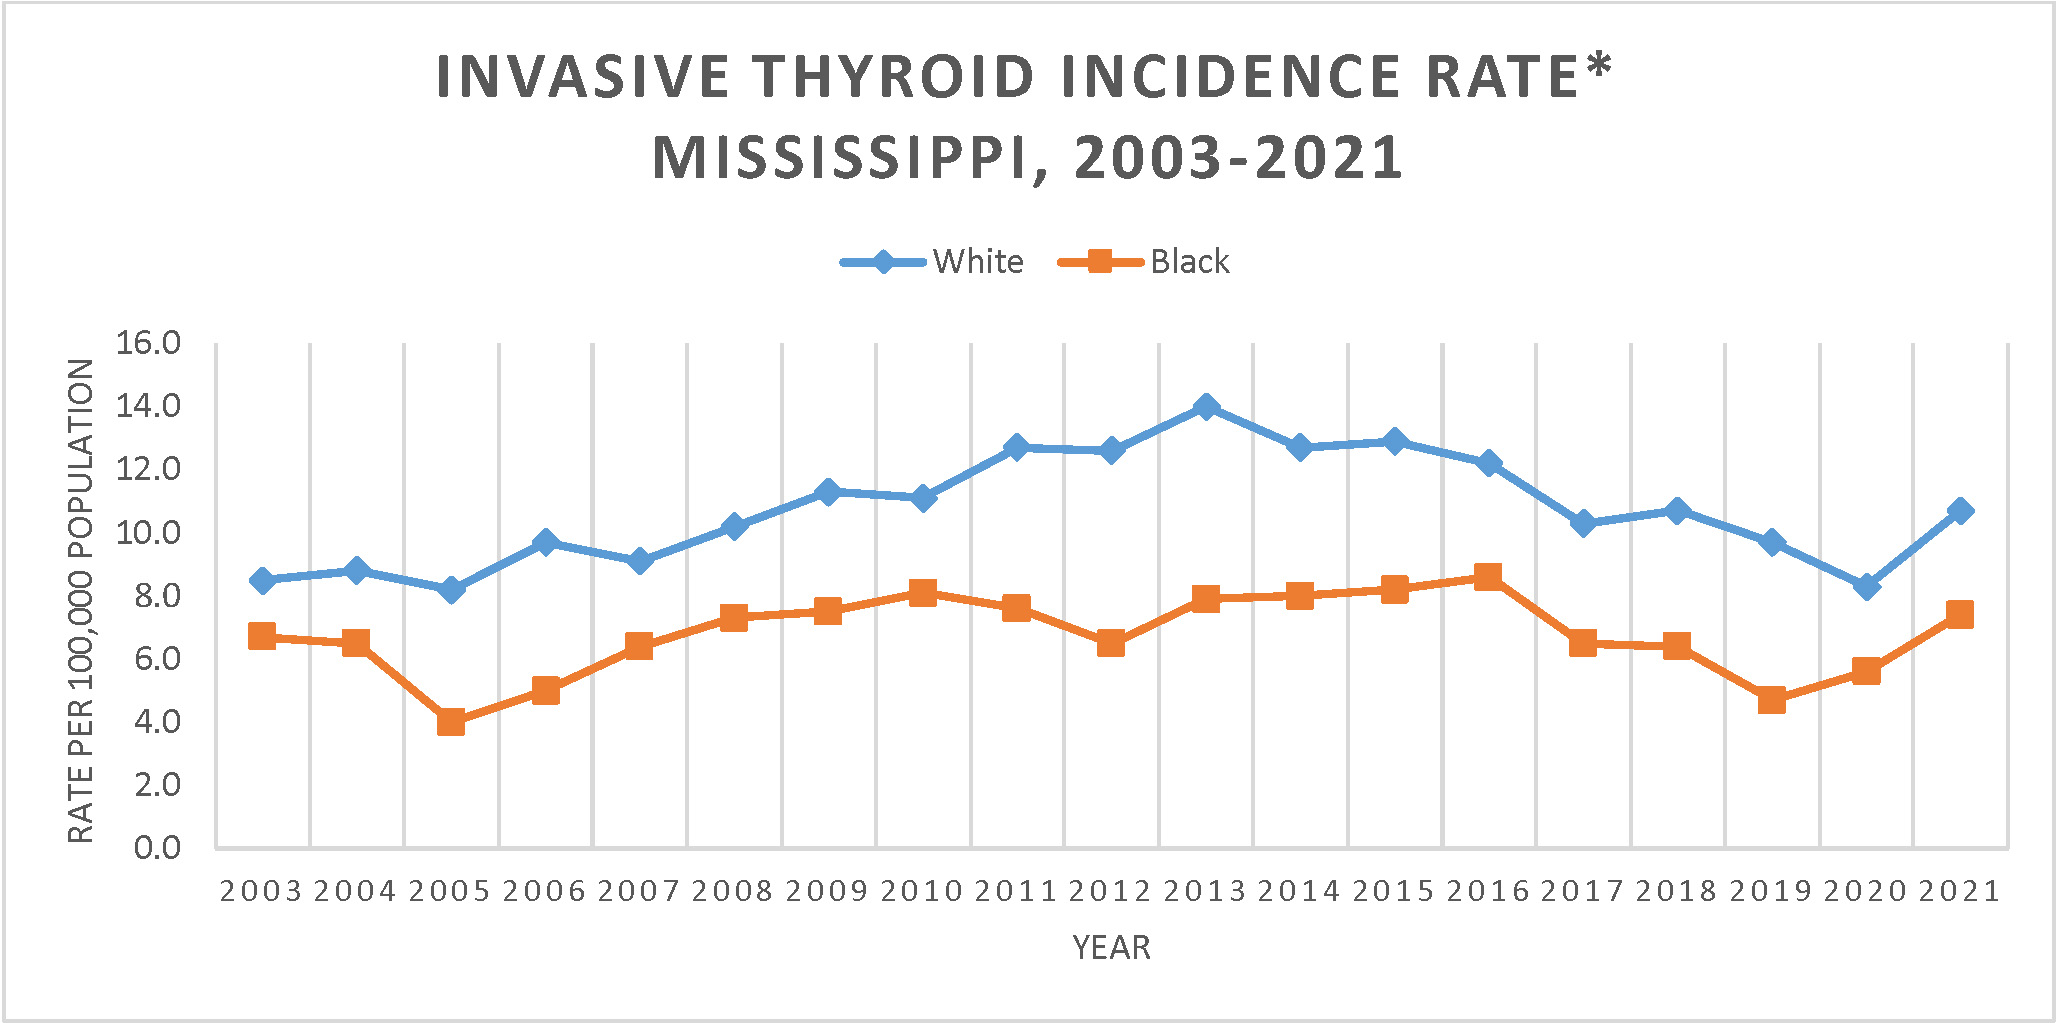
Due to the number of cases diagnosed annually in black males being very small, the rates could not be broken out by both race and sex. Females have significantly higher rates of thyroid cancer than males and the white population has a significantly higher rate of thyroid cancer beginning in 2005. Over the time period between 2003 and 2021, the black population experienced fluctuating observed trends, but the average annual observed trend was an increase of 1.30%. During the period from 2003 to 2013, the white population had a significant annual increase of 5.37%. However, during the period from 2013 to 2021, the white population had a significant annual decrease of 4.68%. For the entire period from 2003 to 2021, the white population had an observed average annual increase of 0.80%.
For the latest five-year period between 2017 and 2021, both groups saw decreasing trends. The rates for whites decreased annually 1.40%, though this change was not statistically significant. The rate of decrease during this period for blacks was a statistically significant 2.12% annually.
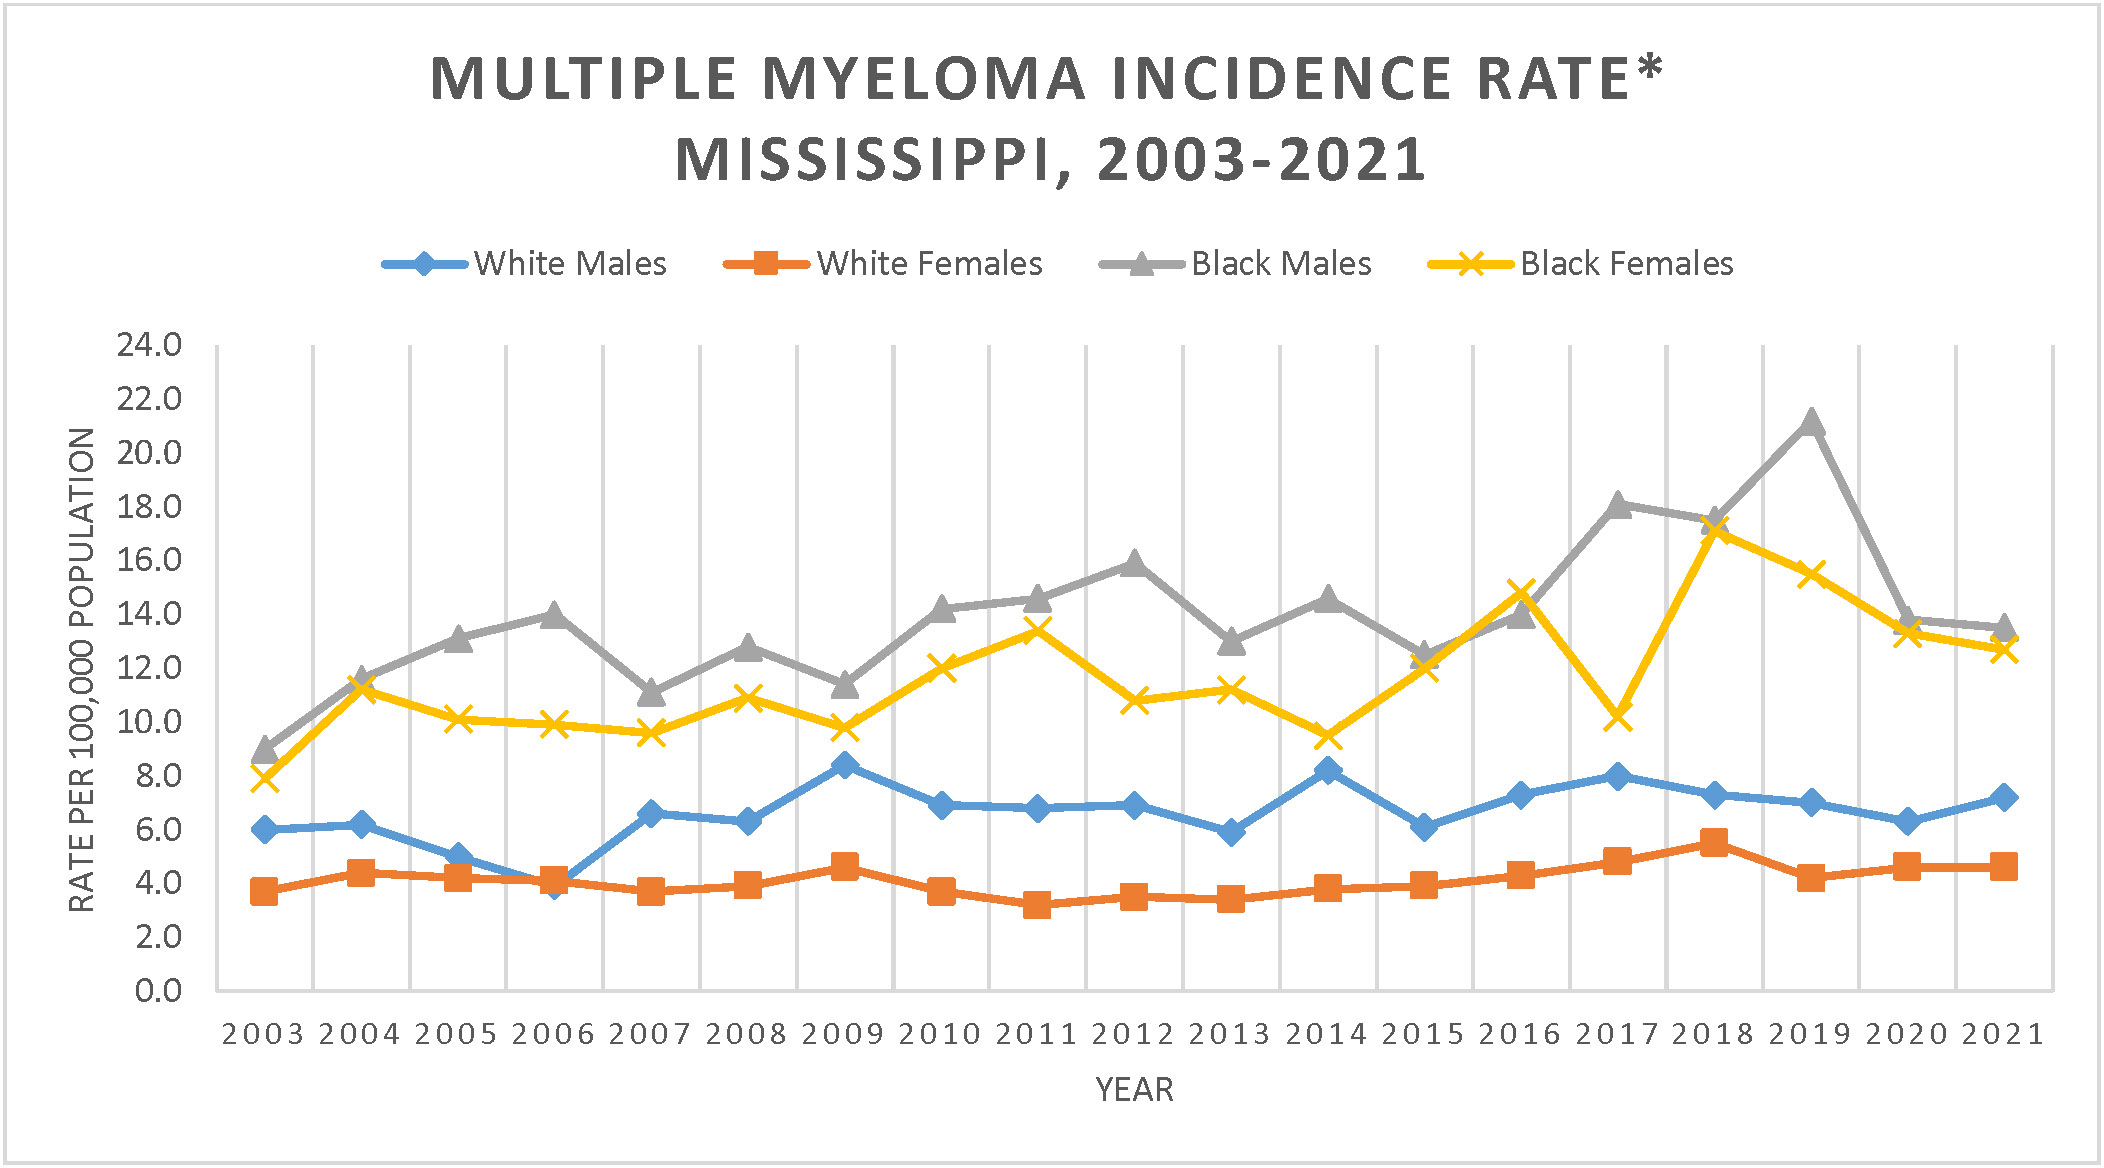
For most time periods, black males and black females had significantly higher rates of multiple myeloma than both white males and white females. Black males and females had similar rates except in 2014, 2017 and 2019 when black males had significantly higher rates. White males had significantly higher rates of multiple myeloma than white females in 2003, from 2007 to 2017, 2019 and 2021. For the period from 2003 to 2021, all groups had an observed annual increase in the rate of multiple myeloma. The rate of increase was statistically significant for black females at 2.45% annually. For black males, the rate increased significantly 3.30% annually between 2003 and 2019 and then decreased at an observed rate of 15.59% between 2019 to 2021. This translates into an observed increase of 1.0% annually over the whole time period. White males also experienced an observed increase annually of 1.29%. White females experienced an observed decrease of 1.77% annually between 2003 and 2012 followed by a significant increase of 3.55% annually between 2012 and 2021. Thus, for the overall period, white females had an observed increase of 0.9%.
Over the most recent five-year time period from 2017 to 2021, all groups experienced an annual decrease in the rates of multiple myeloma over this five-year period except black females, but these changes were not statistically significant. The observed annual decrease for white males was 3.27% and for white females was 2.61%. The observed decrease for black males was 7.36% annually. For black females, there was an observed slight increase of 0.16% annually.
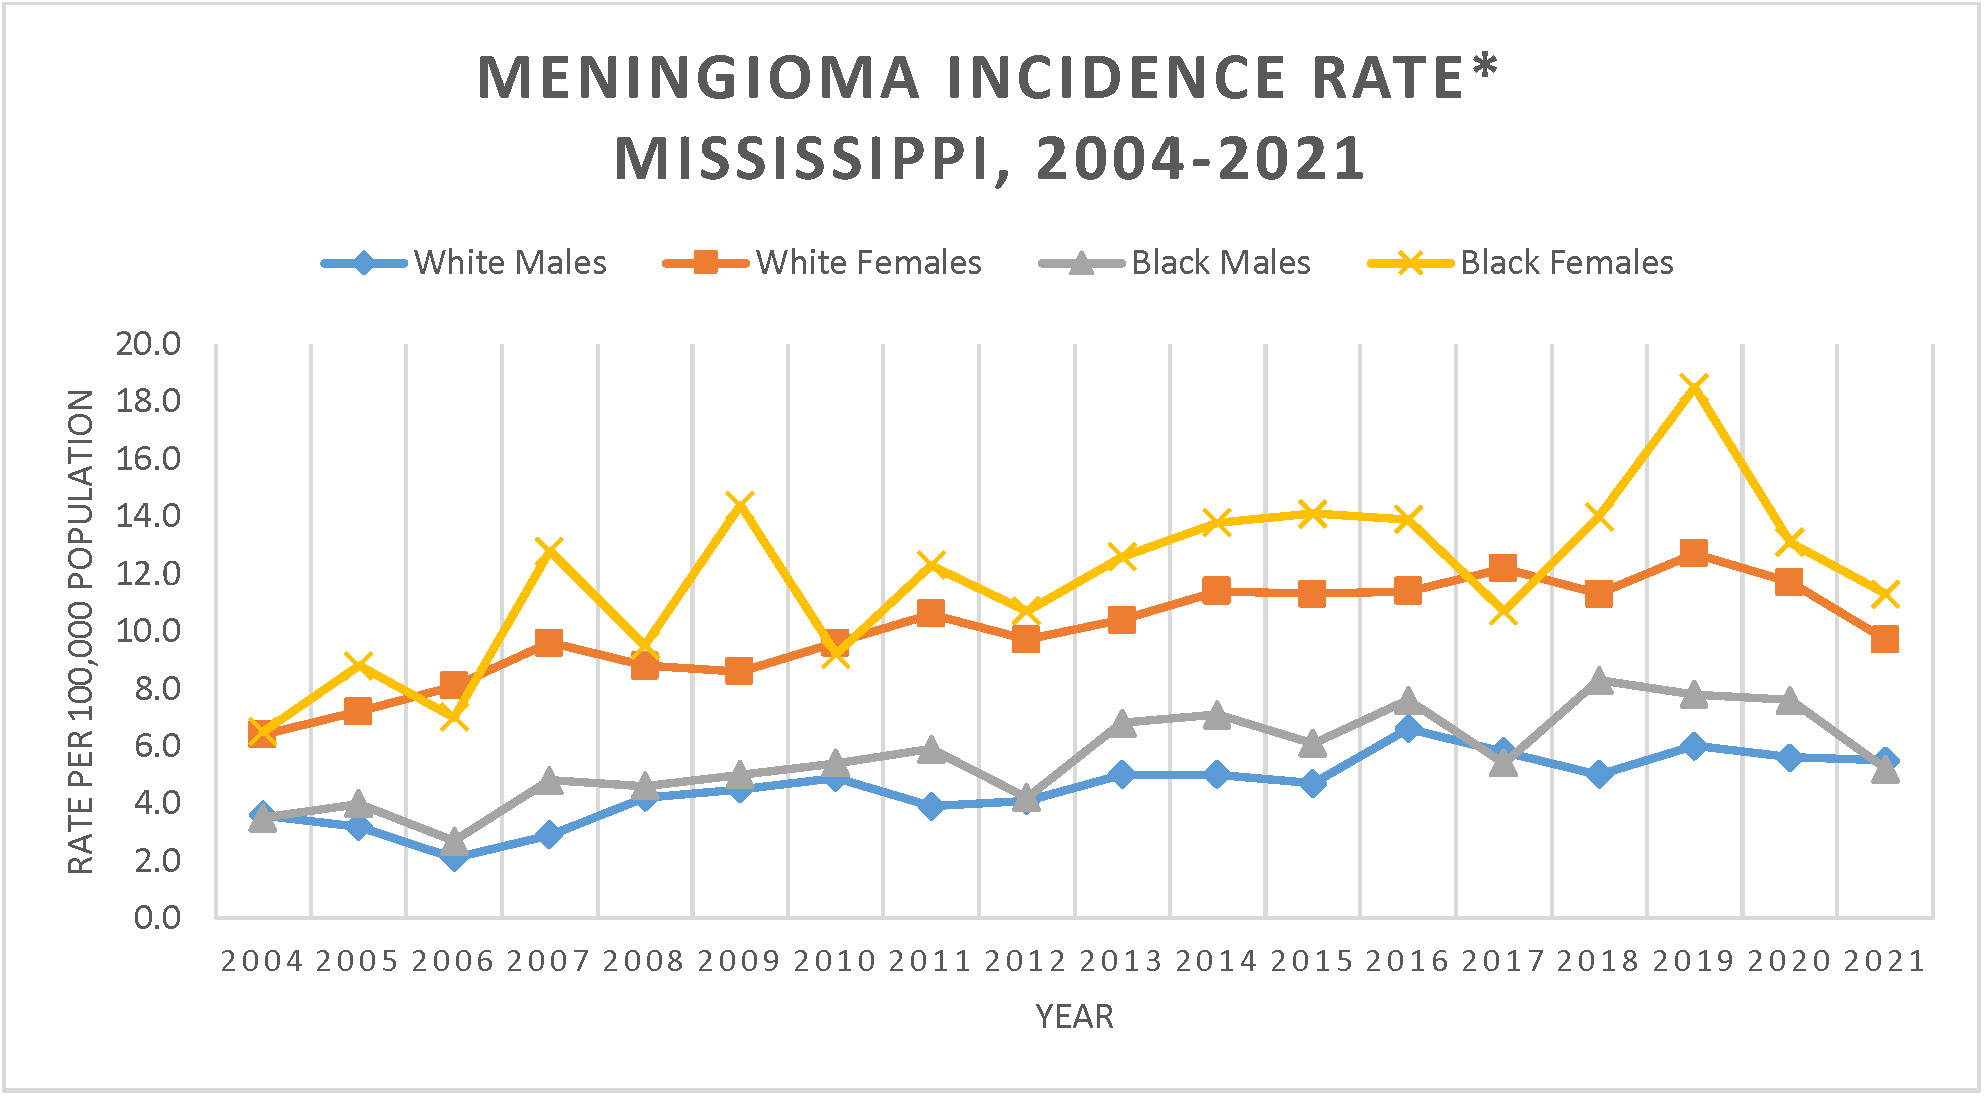
Meningiomas are brain tumors that grow on the surface of the brain and spinal cord. Most are benign. The Mississippi Cancer Registry did not begin collecting benign and borderline tumors of the brain and central nervous system until 2004. Prior to 2004, the cancer registry would have only collected malignant meningiomas which are very rare. The data represented here covers the time period beginning in 2004 instead of 2003 like for the other cancers in this report.
Females had significantly higher rates than males for most years. Within each sex group, the two race groups had similar rates for most years. Meningioma trends were significantly increasing for all groups. White males experienced a significant increase of 3.86% annually and black males experienced a significant increase of 3.12% annually. The trend for black females was an increase of 2.91% annually. For white females between 2004 and 2007, the annual increase was a significant 11.42%. From 2007 to 2019, white females still experienced a significant increase of 2.87%, but this was much lower than the earlier time period. Then for the period from 2019 to 2021, white females experienced a significant decrease of 10.94% annually. For the full time period between 2003 and 2021, white females had a significant average annual increase of 2.6%.
The observed trend for the latest five-year period between 2017 and 2021 was decreasing for all groups except white males, though these changes were not statistically significant. The slight annual increase for white males was 0.08%. For white females, the annual observed decrease was 4.00% and for black females was 0.23%. The observed annual decrease for black males was 2.12%.
Definitions
Age Adjusting: A statistical method that allows comparisons of populations that take into account age-distribution differences between the populations. The 2000 U.S. standard population is used and applied to all of the time periods being considered. This assures that the rates do not reflect differences in the age distribution of the population.
Annual Percent Change (APC): The average annual percent change over several years. It is used to measure the change in rates over time. Calculating the APC involves fitting a straight line to the natural logarithm of the data when it is displayed by calendar year.
Statistical Significance: This is a mathematical measure of the difference between groups. A difference is said to be statistically significant if it is greater than what might be expected to happen by chance alone 95% of the time. Rate ratios were used to assess the statistical significance between groups.
Citations
1Centers for Disease Control and Prevention, National Center for Chronic Disease Prevention and Health Promotion, Division of Population Health. BRFSS Prevalence & Trends Data [online]. 2022. [accessed Jun 3, 2024]. URL: https://www.cdc.gov/brfss/brfssprevalence/index.html.
2Surveillance Research Program, National Cancer Institute SEER*Stat software (seer.cancer.gov/seerstat) version 8.4.3.
Acknowledgement
We acknowledge the Centers for Disease Control and Prevention for their financial support under a cooperative agreement awarded to the Mississippi Cancer Registry.